
Author’s Note
This paper addresses a problem of definition and measurement in residential real estate. The single-family home is the largest asset class in the world, and investors have always reached it through the same few doors: buy a house and rent it out, lend money on it, or buy shares in a company that does one of those things. All of those doors depend on rents, cap rates, the chance to refinance, and being able to sell when you need to. A structure in which an investor and a family own a home together, the family making a fixed payment each month until the home is theirs, is a different door. It has no agreed name. “Co-ownership” is used for a Manhattan co-op, fractional vacation co-ownership, a home equity investment contract, a rent-to-own lease, and the structure my firm operates, and as investments those five things have almost nothing in common. It has no agreed measure. Nobody has fixed how to state a collection rate, a down-payment ratio, or the loss when a resident leaves, so one operator’s numbers cannot be compared with another’s.
The paper proposes a solution to both problems and tests it against evidence. It sets out a definition with five tests, a scorecard of twelve metrics that any operator can report, and EasyDwell’s own record on that scorecard, missed payments, departures and empty homes included. A record with no bad months is marketing. A record that shows its bad months is evidence.
The paper is free to share and cite. It will be updated every year on the same definitions, so a number quoted from it in 2026 can be checked against the number for 2027. Figures still waiting on sign-off are marked that way, not presented as certain. Disagreement with the definitions is welcome. That is how a standard gets better.
Raphael Locsin · Miami, August 2026 · raphael@easydwell.com
Executive Summary
The problem. Investors have historically reached the single-family home through four channels: owning rentals, buying REIT shares, lending on mortgages, or investing in private real estate funds. All four depend on market rents, cap rates, refinancing windows and exit timing. A fifth channel, residential co-ownership, in which an investor and the family living in the home own it together under a contract, has grown without a shared definition or a reporting standard. As a result, the structures that share the name cannot be told apart, and operators’ results cannot be compared.
The background. The conditions behind the channel are well documented. Mortgage rates have stayed above 6% into 2026. The typical home now costs about 6.0 times household income, up from 4.3 times in 2003. First-time buyer purchases in 2025 were about half their historical average, the average first-time buyer is now 40, and the country is short an estimated 1.2 million homes. Millions of households are locked out of conventional ownership. Many of them are cash-rich and credit-poor: they can fund a real down payment and a monthly payment, but they cannot pass bank underwriting. Capital that bridges that gap earns returns that come from contracts rather than from price speculation, and those returns have little to do with what public markets do.
The proposal. The paper defines structured co-ownership and gives five tests that separate it from the other structures that share its name (Section 2). It proposes the Structured Co-Ownership Scorecard, twelve metrics with exact definitions, so that one operator can be compared with another (Section 6).
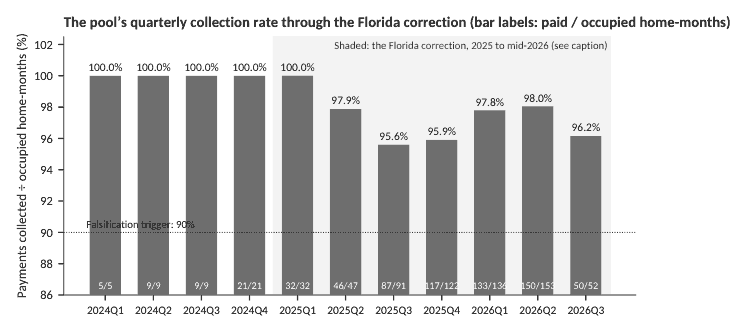
The evidence. The paper reports a reference dataset against that scorecard: 63 homes and 36 months of payment history from the portfolio EasyDwell has run in Florida workforce markets since 2023, of which 56 have been placed with resident co-owners or sold. Across 678 months in which a resident was in a home, 659 payments were made and 19 were missed, a 97.2% collection rate; five residents left; the three repossessed homes were re-filled in 3.2, 4.8 and 5.9 months; and on the day each home was placed, the resident’s down payment returned 53% of the cash the fund had put into it. The same 36 months covered a statewide decline in Florida home values; the collection rate never fell below 95.6% in any quarter (Section 4.4).
Scope. Fund terms, the offering, how the manager buys and finances homes, the investor distribution record and the manager’s roadmap are left out on purpose. They belong in a separate, private supplement.
1.The Housing Market: A Structural Squeeze
Every lasting investment thesis starts with a market dislocation that is structural rather than cyclical. The U.S. housing market of the mid-2020s is exactly that. For years now, the number of households that want to own a home has pulled away from the number that can get a mortgage to buy one.
1.1 Prices Have Outrun Incomes
The core of the affordability problem is not mortgage rates on their own. It is that home prices have pulled away from household incomes, and rates have made it worse. The median home cost about 4.3 times household income in 2003 and 5.1 times in 2017. Today it is nearly 6.0 times. Research from the American Enterprise Institute shows homeownership rates falling 8 to 10 percentage points in every age group between 2000 and 2022. For 35-year-olds the rate dropped from 60% to 50%.
Rates compound the problem. The 30-year fixed rate has moved between roughly 6.0% and 6.7% through late 2025 and the first half of 2026, and major forecasters expect it to stay above 6% through 2026. Meanwhile, roughly 80% of existing mortgages carry rates of 6% or lower. That produces the well-known “lock-in effect”: owners with cheap mortgages do not sell, so resale inventory stays low and prices stay high even as transaction volumes stagnate.
1.2 The First-Time Buyer Collapse
The damage shows most clearly at the entry point of the market. First-time buyer purchases fell to about 1.1 million in 2025, roughly half the historical average, and the average age of a first-time U.S. homebuyer reached 40, a record. Analysts estimate that buying at 40 instead of 30 costs the average household about $150,000 in equity it never builds. Capital Economics, among others, sees “no clear path” to a conventional housing recovery, with activity stuck in a slump since 2023.
| Indicator | Reading (2025–2026) | What it means |
|---|---|---|
| 30-yr fixed mortgage rate | ~6.0%–6.7%; >6% expected through 2026 | Monthly payments elevated; qualification harder |
| Price-to-income multiple | ~6.0x (vs. 4.3x in 2003) | Down payments out of reach for median earners |
| First-time buyer purchases | ~1.1M in 2025 (~half historical avg.) | Entry demand backing up into rentals & alternatives |
| Avg. first-time buyer age | 40 (record high) | ~$150K in foregone equity vs. buying at 30 |
| National housing shortage | ~1.2 million units (NAHB) | Supply response constrained by zoning & labor |
| Mortgage lock-in | ~80% of mortgages at ≤6% | Resale inventory suppressed; prices sticky |
Table 1: Key indicators of the structural squeeze. Sources: NAHB 2026 Housing Outlook; Realtor.com; Redfin; AEI Housing Center; Capital Economics; Freddie Mac PMMS. Figures as reported through H1 2026; refreshed in each annual edition.
1.3 The Cash-Rich, Credit-Poor Household
Inside this constrained market sits a large, underserved group: households with real savings and steady income who still cannot pass conventional bank underwriting. The reasons vary: self-employment and 1099 income, thin or recovering credit files, recent immigration, income that does not fit the standard paperwork, or simply debt-to-income ratios that fail at 6%-plus rates. Banks price the credit score, not the household. On a $257,049 conventional loan at 3% down in mid-2026, a borrower with 760+ credit was quoted 6.70% and a $2,264 monthly payment. A borrower at 620 to 659 was quoted 7.21% to 7.36% and $2,529 to $2,575. Below 620 there was no conventional loan at any price. These families can fund a down payment (the median across EasyDwell’s placed homes is $20,000) and a market-level monthly payment. What they cannot get is a bank mortgage. Tighter lending standards since 2008 have made this group larger and more permanent, not smaller.
The market offers this group one product: a lease. Renting builds no equity, gives no security past the lease term, and, with average U.S. rent up roughly 30% in five years, often costs as much as the ownership payment the household was refused. Co-ownership structures exist to serve exactly this gap, and the capital that funds them is paid for doing so.
2.The Types of Residential Co-Ownership, and a Definition
“Co-ownership” covers any arrangement in which two or more parties hold economic interests in the same home. The structures differ a great deal: who lives in the home, who holds title, how the return is earned, and what the investor actually owns. The differences matter, because the risk and return profiles are not interchangeable, and because the category cannot attract capital at scale until its vocabulary is fixed.
2.1 The Old Forms: Co-ops and Tenancy-in-Common
Housing cooperatives are the oldest American form. Residents own shares in a corporation that owns the building, and each resident’s right to live there comes through a proprietary lease. Co-ops make up roughly 70% of Manhattan’s owned apartment stock, and about 425,000 units nationally are limited- or zero-equity co-ops built to preserve affordability. Tenancy-in-common (TIC) lets several parties hold undivided fractional interests in one property. It is increasingly used by friends and family who pool resources to buy together, often with prenup-style co-ownership agreements. Both are consumer arrangements, not investment strategies, but they established the legal precedents that modern structures rest on.
2.2 Fractional Vacation Co-Ownership
Fractional vacation platforms sell 1/8 to 1/2 shares of luxury second homes through property-specific LLCs. Shares typically cost from roughly $200,000 to $2 million. The buyer gets a real interest in real estate, professional management, and scheduled use. This is a lifestyle product, and it depends on appreciation: the investor and the occupant are the same person, there is no contractual income, and returns depend on luxury second-home values. It shows that the LLC-share chassis works at scale, but economically it is a different thing from income-oriented co-ownership.
2.3 Home Equity Investments (HEIs)
HEI providers (Point, Hometap, Unison, Unlock and Splitero are the recognized leaders) pay an existing homeowner a lump sum today in exchange for a share of the home’s future value, settled when the home sells or the owner buys the interest back. The homeowner takes on no debt and makes no monthly payment. For the investor, an HEI is a zero-coupon instrument linked to appreciation: all of the return arrives at exit, it depends on home prices rising over a 10-to-30-year window, and there is no cash flow in between. HEI portfolios have drawn institutional securitization and rating-agency coverage, which validates shared-equity contracts as an institutional asset. But the cash-flow profile is the opposite of what an income mandate wants.
2.4 Lease-Purchase / Rent-to-Own
Rent-to-own operators buy homes chosen by aspiring buyers, lease them back with an option to purchase, and credit part of the rent toward a future down payment. The model earns rental income plus an option premium, but the occupant stays a tenant: tenant-level commitment, eviction as the remedy, and conversion rates that have historically disappointed. The investor’s return blends rental yield with the occupant’s eventual mortgage qualification, which brings back the dependence on the very mortgage market the occupant was excluded from.
2.5 Structured Co-Ownership (Shared-Equity Occupancy)
The last segment, and the subject of this paper, puts the investor and the occupant in genuine co-ownership of an owner-occupied primary home from day one. The home is held in an entity, a property-specific LLC, whose economic interests are divided into shares. The resident buys an initial stake with a down payment, makes fixed monthly payments under a long-term (30-year) shared-equity agreement, lives in and maintains the home, and builds equity toward full ownership. The investor holds the rest of the shares, receives the contractual payment stream, and shares in the equity upside if the resident exits early through a sale.
What sets structured co-ownership apart is alignment. The occupant has an owner’s financial commitment: a down payment at risk, equity accruing, and responsibility for maintenance. The investor has a lender’s payment priority with an owner’s collateral. The result is a hybrid that behaves, in a portfolio, like private residential credit secured by a deeply committed counterparty, with retained equity that shares in appreciation, and in decline, on any sale, refinance or buyout before term.
2.6 The Definition and the Five Tests
Table 2 applies the five tests to the five structures of Sections 2.1 to 2.5.
| Model | Where the investor’s return comes from | Occupant’s position | Cash-flow profile | Five Tests |
|---|---|---|---|---|
| Co-ops / TIC | Use value; resale of shares/interests | Owner-resident | None (consumer structure) | Passes 1–2; fails 3–5 |
| Fractional vacation co-ownership | Appreciation of luxury 2nd homes | Owner-user (part-time) | None; exit-dependent | Fails 1, 3, 4 |
| HEIs (Point, Hometap, Unison) | Share of future appreciation | Existing homeowner | Zero-coupon; realized at exit | Passes 1–2; fails 3–4 |
| Rent-to-own / lease-purchase | Rent + option premium + sale | Tenant with option | Rental yield; conversion risk | Fails 2 and 4 |
| Structured co-ownership | Down payment + fixed monthly payments + shared equity on early exit | Co-owner-resident (30-yr agreement) | Contractual monthly income from inception | Passes all five |
Table 2: The types of residential co-ownership against the Five Tests. Sources: company disclosures and industry coverage; author’s definitions.
3.Why Co-Ownership, and Why Now
Four forces have come together to make co-ownership an investable category now, rather than a niche curiosity.
3.1 Demand: A Qualification Gap That Is Not Going Away
The qualification gap in Section 1 is not an artifact of the rate cycle. Even if mortgage rates fall back toward 6%, the price-to-income gap, the supply shortage, and post-2008 underwriting standards remain. Demographics add to demand: the largest first-time-buyer cohorts in history, late-millennial and Gen Z households, are reaching the age of household formation in the least accessible purchase market in decades. Redfin researchers note that households are already adapting: more co-buying among friends and family, more multigenerational arrangements. Both signal that shared ownership is becoming culturally normal.
3.2 Supply: Motivated Sellers
The same frictions that lock buyers out create buying opportunities. Homes that sit unsold for 120+ days, distressed or relocating sellers, and inherited homes give disciplined buyers discounted entry points.
3.3 Capital: The Search for Income That Does Not Track the Market
On the capital side, Deloitte’s 2026 institutional outlook documents investors increasingly seeking private-market strategies specifically because they do not move with public markets, and partnering with specialist operators to reach property types that need specialized knowledge. Family offices in particular face a recurring problem in building portfolios: fixed income yields remain modest in real terms, listed REITs deliver stock-market beta rather than diversification, and core private real estate remains exposed to cap-rate and refinancing cycles. A residential payment stream fixed at signing and independent of market rents fills a gap none of those allocations fill.
3.4 Infrastructure: The Legal and Operating Pieces Now Exist
The infrastructure now exists at small-fund scale. Property-specific LLC structures are well precedented (the fractional ownership platforms proved them at scale). Third-party fund administration, asset-level reporting, and 506(c) private offering frameworks are within reach of emerging managers. And servicing technology lets a lean team manage occupant relationships across dozens of properties with institutional discipline. What the category still lacks is a reporting standard, which Section 6 proposes.
4.The Investment Case: Contract Income, Not a Bet on Prices
4.1 Where the Return Comes From
In a structured co-ownership portfolio the investor’s return comes from three sources, listed from largest to smallest. On the modeled composition of EasyDwell’s realized experience: contractual monthly payments contribute roughly 65% of investor returns, day-one down payments roughly 25%, and shared equity upside on early resident exits roughly 10%. That is the manager’s modeled long-run mix; no resident buyout or refinance has yet occurred (Section 6.3). About 90% of the return is therefore set by contract at the closing table, before any assumption about home prices is made. Whether a day-one down payment is treated as income or as a return of invested capital is an accounting-policy choice that each operator should state. The treatment used in the reference dataset is described in Appendix A.
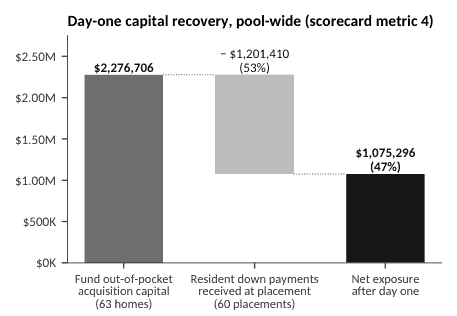
The down payment deserves attention because it is the feature most foreign to conventional real estate underwriting. When the occupant pays a down payment at closing (median $19,999 across the pool, 7.8% of contract price), the fund’s net basis in the home drops at once. Across EasyDwell’s 63 funded homes, down payments have returned 53% of out-of-pocket capital at closing. That shortens payback, raises cash-on-cash returns, and puts the counterparty’s own money into the home on day one. Under the agreement that money is realized rather than forfeited if the resident leaves (Section 5.2). So it works as day-one capital recovery for the investor and as a commitment device for the resident, not as a first-loss layer in a price decline.
4.2 How It Compares
| Dimension | Listed Residential REITs | SFR Rental (Direct/Funds) | Structured Co-Ownership |
|---|---|---|---|
| What drives the return | Cap rates, equity sentiment | Market rents, occupancy, appreciation | Occupant payments fixed at signing |
| Correlation with public markets | High (trades as a stock) | Moderate | Low by construction; not yet tested through a national downturn |
| Counterparty commitment | Tenants (12-month leases) | Tenants; turnover of 30–50% a year is typical | Co-owner residents with a median $20K at risk |
| Maintenance / capex | Owner pays | Owner pays; a major drag on net yield | Resident pays under the agreement |
| Dependence on an exit | Continuous (share price) | High; returns realized at sale or refinance | Low; a 30-year amortizing payment stream |
Table 3: How the structures compare. REIT and SFR figures are general industry ranges for orientation.
4.3 Why the Income Does Not Track the Market
The case for low correlation is mechanical, not statistical. The fund’s income does not reprice when the 10-year Treasury moves, because the payments were fixed at closing. It does not reprice when market rents soften, because occupants are paying toward ownership, not paying rent. Cap-rate compression is beside the point, because no sale or refinancing is needed to realize the return. The main channel through which macro stress reaches the portfolio is the resident’s ability to pay: a lost job, or escrow rising with Florida taxes and insurance. That risk is real (Section 7). It is softened by the equity the occupant has sunk into the home, and it looks far more like consumer-credit risk than like real estate beta.
4.4 The Test So Far: Florida’s Correction, 2023 to 2026
The mechanical argument can be checked against what actually happened. The 36 months of the dataset ran through the weakest housing market of any large state.
What happened to the market. Florida values peaked in 2024 and have been falling since. By July 2026 the typical home was worth 1.8% less than a year earlier and about 6% less than the 2024 average. Three in four Florida ZIP codes had lost value over the year, and two in three were below where they stood when the dataset began in mid-2023. Homes took two to three months to sell, one listing in four had cut its price, mortgage rates stayed between 6% and 7%, and the average home insurance premium rose 18% in 2025 alone, to $8,292, the highest in the country.
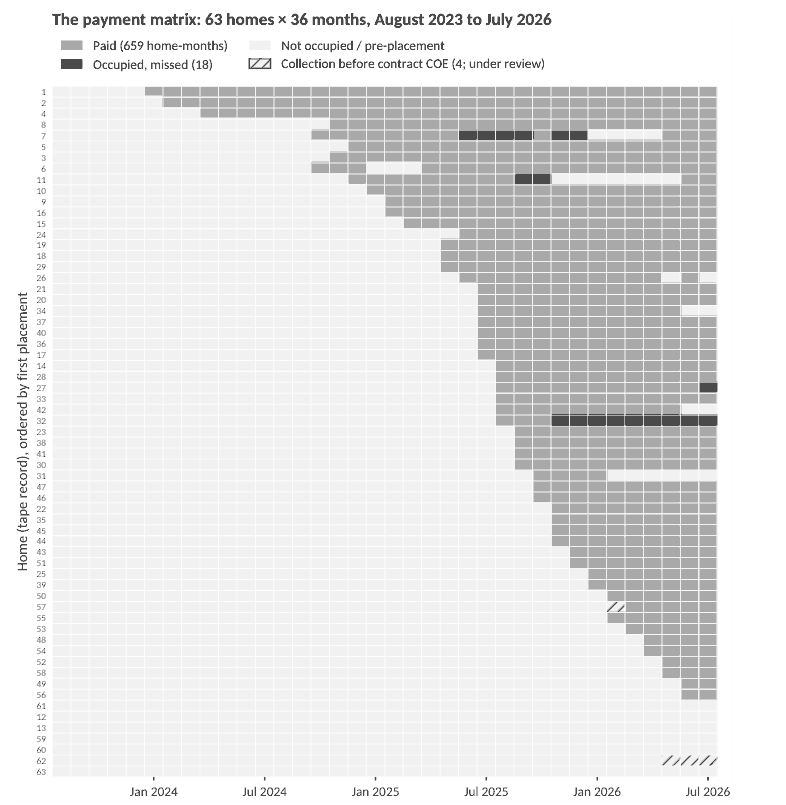
What the pool did. Contracted payments did not change. Collections were 100% until the correction began and never fell below 95.6% after it (Figure 1). Forty-three homes were placed into that market in 2025 at prices at or near the fund’s basis, while sellers around them were cutting and withdrawing. The three repossessed homes were re-placed in three to six months, in the same market. The three homes in the state’s hardest-hit counties have paid every month.
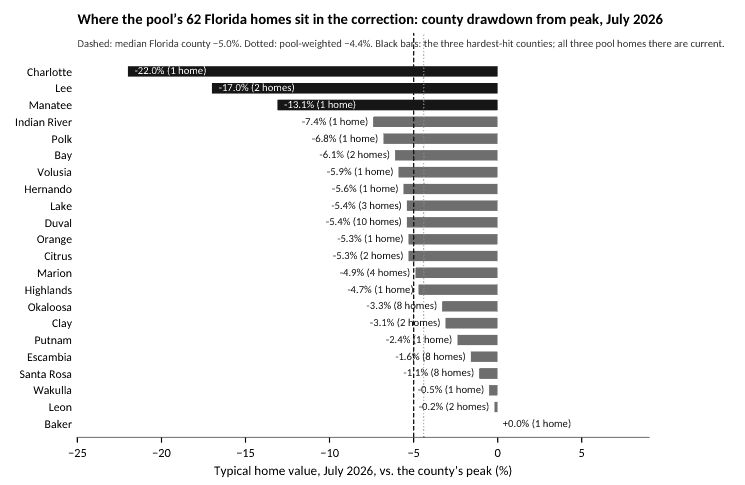
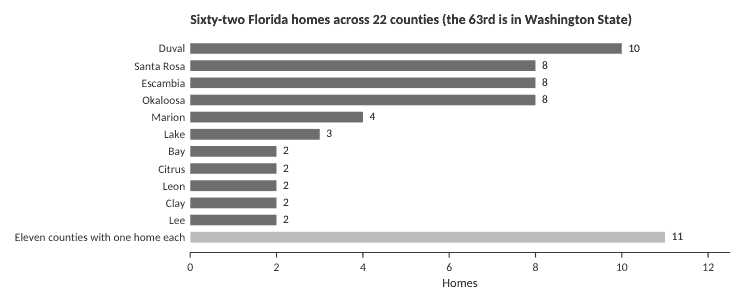
Where the pool’s homes sat. The correction was uneven, and the pool’s homes sat in the milder part of it. Twenty-four of the 62 Florida homes are in the Panhandle, which held flat. Weighted by where the homes are, the pool’s counties were 0.7% below a year earlier and 4.4% below their peak in July 2026, against a median Florida county 5.0% below peak. Three homes sit in the hardest-hit counties, 13% to 22% below peak. Table 4 and Figure 2 show the detail.
| County | Pool homes | Typical value, Jul 2026 | 1-year change | vs. 2022 average | vs. peak | Days on market | Listings with a price cut |
|---|---|---|---|---|---|---|---|
| Duval | 10 | $296,317 | −1.2% | −4.9% | −5.4% | 59 | 28.5% |
| Santa Rosa | 8 | $353,670 | +0.9% | +1.2% | −1.1% | 57 | 26.9% |
| Escambia | 8 | $282,520 | +1.3% | +2.6% | −1.6% | 66 | 28.8% |
| Okaloosa | 8 | $356,683 | +0.4% | −3.1% | −3.3% | 79 | 25.2% |
| Marion | 4 | $272,792 | −2.5% | −2.4% | −4.9% | 79 | 26.3% |
| Lake | 3 | $363,142 | −2.8% | −3.1% | −5.4% | 72 | 29.9% |
| Bay | 2 | $344,902 | −0.9% | −3.5% | −6.1% | 90 | 25.9% |
| Citrus | 2 | $272,870 | −1.7% | −3.1% | −5.3% | 80 | 27.4% |
| Clay | 2 | $337,847 | −0.8% | −2.9% | −3.1% | 62 | 30.4% |
| Lee | 2 | $337,352 | −5.4% | −16.8% | −17.0% | 94 | 22.4% |
| Leon | 2 | $296,441 | +1.2% | +7.0% | −0.2% | 50 | 27.6% |
| Eleven counties with one home | 11 | $220,059 to $409,772 | −6.6% to +3.8% | −22.0% to +7.0% | −22.0% to 0.0% | 61 to 94 | 21.6% to 33.7% |
| Pool-weighted | 62 | — | −0.7% | −2.1% | −4.4% | 70 | 27.2% |
| Florida, statewide | — | $393,034 | −1.8% | — | median county −5.0% | — | 24.3% |
Table 4: The pool’s Florida counties in the correction. County figures are Zillow Home Value Index typical values and Zillow listing series for July 2026, as compiled in Momentum Realty’s Florida Housing Tracker release of 24 August 2026; “vs. peak” is the county’s highest annual average since 2012 or highest month in the trailing 13. Pool-weighted rows weight each county by the number of pool homes in it. The one-home counties are Baker, Charlotte, Hernando, Highlands, Indian River, Manatee, Orange, Polk, Putnam, Volusia and Wakulla.
What this shows, and what it does not. It shows the mechanism working: prices fell, rates and insurance rose, and the payments did not reprice while 97% of them were collected. It also shows where stress travels. The two weakest quarters, at 95.6% and 95.9%, were the second half of 2025, the steepest part of the decline and the year of the insurance jump. That is the resident’s ability to pay, the channel this paper expects. It does not show immunity. This was a moderate correction, not a crash; the pool sits in the more resilient half of the state; and 36 months is not a cycle. The mechanical argument has been tested by a real downturn, not yet by a severe one.
4.5 What Co-Ownership Is Not
It is worth being clear about what the thesis does not claim. Structured co-ownership is illiquid: there is no secondary market for fund interests, and five-year lockups are standard. The value at signing is the contract price agreed with the resident, not an independent appraisal, and independent valuation coverage is a gap the category should close. The strategy takes a lot of operating work; it depends on the manager’s execution in sourcing, underwriting and servicing; and at today’s fund sizes it is concentrated in one geography. And the realized track records in the category, EasyDwell’s included, are measured in years rather than decades and have not been through a severe national housing recession. Investors should size allocations accordingly.
5.How a Structured Co-Ownership Contract Works
5.1 What the Monthly Payment Is Made Of
The resident’s monthly payment has three parts, and the difference between them matters for every yield figure in this paper. Occupancy pays for the resident’s use of the share of the home the fund still owns. It is fixed when the contract is signed. Equity buys a slice of the home each month. It is also fixed at signing, and it pays off the fund’s share over 360 months, so the resident owns more every month. Escrow is the resident’s own property tax, insurance and any association dues. The servicer collects it and passes it through. It is reviewed at least once a year and reset when a bill changes materially. It is never treated as fixed and never counted as income. Every payment and yield figure in this paper leaves escrow out.
EasyDwell’s current agreement (the Co-Ownership & Equity Purchase Agreement, August 2026 form) sets the mechanics exactly. Each home is held by its own company, divided into 1,000 units. The resident’s down payment buys the first units at closing. Each month the equity payment buys a fixed number more (the fund’s starting units divided by 360) at a fixed price per unit (the agreed starting value divided by 1,000). The down payment plus 360 equity payments therefore add up to the starting value exactly, with no premium (§2.2(b), Exhibit A). The occupancy charge is set once at signing, inside a documented range of comparable homes kept in the transaction file. It does not fall as the resident’s share grows, and it ends when the resident reaches 100% (§2.2(a)). Payments are applied to escrow first, then occupancy, then equity, then any arrears. A short payment therefore costs the resident ownership, not cash (§2.8). A payment 15 or more days late carries one 5% late fee (§2.7). Where the home carries an assumed mortgage, the servicer pays that loan first out of each collection (§9).
| Part | Fixed or not | What it is |
|---|---|---|
| Occupancy | Fixed at signing | A fair charge for using the share the fund still owns, set once from documented comparable homes. It buys no units. It is not rent, interest or a loan payment. |
| Equity | Fixed at signing | Buys a fixed number of units each month at a fixed price. Pays off the fund’s share over 360 months. Builds the resident’s stake. |
| Escrow | Pass-through; reviewed yearly, reset on a material change | The resident’s own property tax, insurance and association dues, collected and passed on by the servicer. Not income. |
Table 5: The three parts of the monthly payment. Source: EasyDwell Co-Ownership & Equity Purchase Agreement, August 2026 form, §§2.2–2.3, 2.7–2.8, Appendix C and Exhibit B (buyer’s annotated copy; certain elective terms are being finalized with counsel).
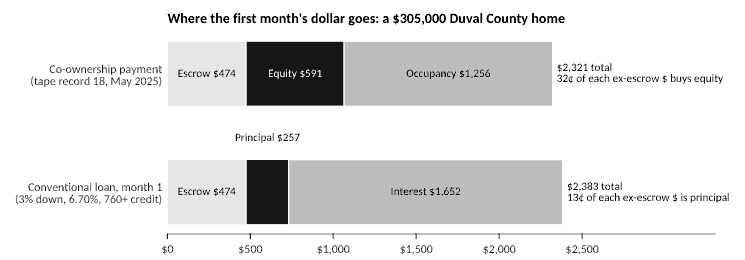
The clearest way to see the structure is to set it beside a bank mortgage on a real home from the dataset, not on a quote. A Duval County, Florida home was placed in May 2025 at a contract price of $305,000 with a $20,000 down payment (6.6%). The resident has paid 15 of 15 months to the July 2026 cutoff (address withheld; tape record 18). The payment is $2,321.24 a month. $474.25 of that is escrow for tax and insurance. Of the remaining $1,846.99, the tape’s share model puts $591 (32%) toward buying equity and $1,256 (68%) toward occupancy. So 32 cents of every dollar after escrow buys the home from the first month, the split never changes, and at month 360 the family owns the home outright. A conventional borrower buying the same home with 3% down at 6.70% (the best rate available in August 2026, for 760+ credit) would pay $1,909 a month in principal and interest. Only $257 of that, 13 cents per dollar, is principal in month one. It rises slowly; about 20 years pass before half the payment is principal. Across the 54 placed homes on the tape with a unitized split, the equity share is a median 32% of the payment after escrow (range 0% to 53%; three early contracts have no equity component). Taxes and insurance are the same on both sides. The resident carries no loan, no debt on their balance sheet, and owes nothing if they walk away.
5.2 The Legal Structure in Plain Terms
The terms below are those of the current form of EasyDwell’s agreement (the Co-Ownership & Equity Purchase Agreement with its operating agreement, servicing agreement, appendices and exhibits, August 2026 form, cited by section). The existing pool was placed under earlier forms of the agreement, which the manager is bringing into line with this one. Which contracts are on which form is a reporting item in Section 6.3.
Entity and title. Each home is held by its own Florida limited liability company (the “Company”). The Company’s only asset is the beneficial interest in a land trust that holds legal title to the home. At placement, the fund’s property-holding entity (the “Assignor”) owns all 1,000 membership units of the Company. The resident’s down payment buys the first units at closing, and the monthly equity payments buy the rest over 360 months (Recitals, §§1–2). A Memorandum of Co-Ownership giving notice of the resident’s equitable interest is recorded in the county records at closing, behind the assumed mortgage. After closing, neither party may put any further lien on the home (§5, §7.1, Exhibit C). When the resident reaches 100%, and once the assumed mortgage has been paid off, the Company conveys the home to the resident by special-warranty deed, or the Assignor withdraws and leaves the resident as the sole member (§2.4). The fund’s ownership percentage in each home is stated in the data tape.
Purchase and placement pricing. The resident’s contract price, called the “Starting Value” in the agreement, is negotiated between the parties at signing and is not set by an appraisal (§2.5). It fixes the unit price for the whole term. At placement the Starting Value is set against the fund’s gross acquisition basis, and on the current tape the two are close: the median placed home’s contract price is 2% below gross basis (23 of 56 placed homes are above basis, 33 below). So the fund’s economics come from the payment spread, meaning the contract payment after escrow (median $1,847) over the underlying debt service it covers (median $1,148), and from the day-one down payment, not from a mark-up at placement. Where a mark-up exists, it accrues to the fund’s contract position, is paid down by the resident’s equity payments, and is realized through the payment stream and on exit. It is not a fee paid to the manager. Contract price, gross basis and in-place financing for each home are stated in the data tape and disclosed in diligence. Purchases and placements may carry realtor commissions and closing costs. On the purchase side these are paid at closing and carried in the per-home acquisition cost fields (the Nexus records closing costs of $330,837 across 61 homes and seller’s-agent fees of $81,665 on 15 homes) and in total actualized investment, not in the contract price. On the placement side they are transaction costs of the placement and are among the uses of capital reported in the operator’s private supplement. Where an EasyDwell affiliate acts as the brokerage on a transaction, the commission is an affiliate fee. The agreement discloses the affiliate servicer’s fees to the resident (a $200 set-up fee and $50 per month, with increases capped at 5% a year; Servicing Agreement §2).
Resident selection and the buy box. Residents are underwritten to a published buy box: verified down-payment funds, documentation of income and capacity to pay, and intent to live in the home. The operator underwrites the evidence of ability to pay, not the credit score. The agreement requires the resident to occupy the home as a principal residence (long-term leasing is allowed only above a stated ownership threshold and with consent; no short-term rentals, §3.4). It gives the resident a plain-language disclosure of the assumed mortgage taken from the lender’s own statement (Appendix A), a month-by-month ownership schedule showing the resident’s share of sale proceeds across a range of future values (Exhibit A-1), and a stated review period. It advises the resident in writing to get independent counsel and HUD-approved housing counseling before signing (§§2.9, 8.2). The down payment may be paid partly in monthly installments through the first months of the term (§2.1).
Remedies and the cure path. A missed payment triggers written notice and a fifteen-day period to cure; a non-monetary default gets thirty days (§§4.1–4.2). If the default is not cured, the fund chooses one of four paths. On every path the resident’s accumulated equity is realized, not forfeited, and the resident never owes a deficiency. Under an expedited sale (§4.3), the proceeds first pay the costs of sale and the assumed mortgage, then the resident’s arrears, escrow advances and the fund’s documented costs, and the remainder is split by ownership percentage. The resident can cure and reinstate until a sale contract is signed, at most twice in any 24 months. Instead of selling, the fund may offer to buy the resident’s units for an agreed amount (§4.4(a)), or repurchase them by notice at a formula price: the resident’s ownership percentage of the Starting Value, less the mortgage balance and a cost allowance, less amounts owed and a liquidated-damages retention, never below zero, payable within a stated period (§4.4(b)). The two elective percentages in that formula are being finalized with counsel. A negotiated walk-away is also available (§4.5). The resident may surrender at any time and is released from all further payments, keeping their ownership-percentage share of net proceeds when the home is later sold (§4.6). Possession never changes by self-help. The resident is not required to leave until the equity has been paid or tendered. After that, possession is recovered, if necessary, by ejectment or unlawful detainer as a non-tenant occupant under Chapters 66 and 82, Florida Statutes, not by mortgage foreclosure (§§4.7, 4.9; Operating Agreement §3.06(g)), subject to the recharacterization risk discussed in Section 9. The down payment itself is earned when paid (§2.9); what the resident keeps is the units it bought, valued through these paths. Early in the term, with an assumed mortgage close to the Starting Value, that share can be small or zero, and the agreement says so to the resident in plain terms (Exhibit A, A-6).
5.3 How a Contract Ends
There are four ways a contract ends, all of them written into the contract. Scheduled completion: after the 360th equity payment the resident owns 100%, the occupancy charge ends, and the fund must have paid off the assumed mortgage by then (§2.4, §7.1). Early buyout or third-party refinance, at any time and with no penalty: the resident buys the fund’s remaining units at the fund’s ownership percentage of the home’s appraised net equity (the appraiser is chosen jointly, or the median of three is used), with no selling costs deducted, and the assumed mortgage is paid off at the buyout closing (§2.6). Sale before completion: net proceeds after the mortgage and customary selling costs are shared by ownership percentage, so both parties share in appreciation and in decline (§2.5). Departure: the cure and remedy paths of Section 5.2, under which the resident’s equity is realized rather than forfeited. Realized exit history is kept in the data tape and summarized in Section 6.3. No early buyout, refinance or scheduled completion has yet occurred.
6.The Structured Co-Ownership Scorecard: A Proposed Reporting Standard
6.1 Why a Standard
Single-family rental became an institutional allocation after 2012, when its reporting standardized: occupancy, turnover, rent growth and net yield came to mean the same thing at every operator. Home equity investments reached the securitization market once the rating agencies fixed their vocabulary. Structured co-ownership has neither, and until it does no operator’s results can be compared and every allocator’s diligence starts from zero. The scorecard below is offered as that standard. The definitions are deliberately simple, every metric can be computed from a contract-level data tape, and operators are invited to publish against it.
6.2 The Twelve Metrics
| # | Metric | Definition |
|---|---|---|
| 1 | Collection rate | Contract payments received ÷ contract payments due, counted over occupied home-months (months with a resident under agreement). |
| 2 | Paying occupancy | Records with a paying resident ÷ total records at the reporting cutoff; vacant and non-paying records stated separately. |
| 3 | Down-payment ratio | Median resident down payment ÷ contract price at placement. |
| 4 | Day-one capital recovery | Resident down payments ÷ investor out-of-pocket acquisition capital, pool-wide. |
| 5 | Payment-to-income at placement | Median total monthly payment (ex-escrow) ÷ verified monthly household income at placement. |
| 6 | Departure rate | Resident departures ÷ record-years of exposure, split into repossessions (non-performance) and turnovers (voluntary exit). |
| 7 | Re-placement time | Months from a departure to a new paying resident, per departed home. |
| 8 | Loss severity | (Investor basis in the home − net proceeds or re-placement contract value) ÷ investor basis, per departure; negative values are gains. |
| 9 | Resident equity accrued | Down payment plus cumulative equity-component payments, per household, and in aggregate. |
| 10 | Exit mix | Share of resolved contracts by outcome: scheduled completion, early buyout, refinance, sale with shared proceeds, departure. |
| 11 | Cushion to basis | (Contract price − investor basis) ÷ contract price, median across placed homes; the home-price decline the pool absorbs before a re-placement at basis is impaired. |
| 12 | In-place financing ratio | Assumed or wrapped mortgage debt ÷ gross acquisition basis, with the weighted average rate. |
Table 6: The Structured Co-Ownership Scorecard. Proposed by the author; definitions are open for comment and will be versioned with each annual edition.
6.3 The Reference Dataset: First Data Points
The figures below come from EasyDwell’s contract-level data tape v2.6: 63 funded homes with recorded purchase prices and payment history from August 2023 to July 2026. The records span Fund I-era and earlier SPV entities; which entity holds which home is still being verified, and two homes were added to the tape on 14 August 2026 pending confirmation. The servicing data is preliminary, unaudited operating data at the asset level. It is not investor performance. Sixty-one of the 63 homes carry in-place financing at a balance-weighted 4.0%, reported as metric 12; how that financing is underwritten is outside this paper.
| # | Metric | EasyDwell, cutoff July 2026 | Detail |
|---|---|---|---|
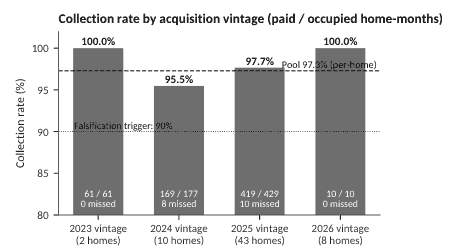
| 1 | Collection rate | 97.2% | 659 paid of 678 occupied home-months; 19 missed; two delinquency spells cured (the tape’s headline; its per-home columns add to 677 / 659 / 18, or 97.3%). Two homes were behind at the cutoff: one by nine consecutive months, one by a single month. By vintage: 2023 homes 100%; 2024 homes 95.5%; 2025 homes 97.7%; 2026 homes 100%. |
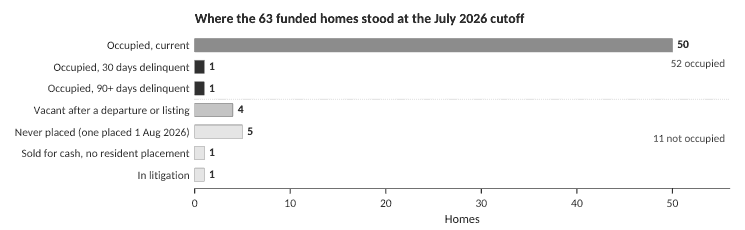
| 2 | Paying occupancy | 50 of 63 (79%) | 52 homes occupied at the cutoff: 50 current, one 30 days behind, one 90+ days behind. 11 not occupied: four vacant after a departure or listing, five never placed (one of them placed on 1 August 2026, after the cutoff), one sold for cash, one in litigation. |
| 3 | Down-payment ratio | 7.8% (median $19,999) | 60 placements with a recorded down payment; range 1.0% to 19.9% of contract price ($2,740 to $47,011). |
| 4 | Day-one capital recovery | 53% | $1,201,410 of down payments ÷ $2,276,706 of fund out-of-pocket capital; net exposure after day one $1,075,296. The down-payment total includes $112,000 on five homes not counted as placed at the cutoff (three under contract, one occupied since June 2026 whose placement count has not yet been updated, one in litigation). |
| 5 | Payment-to-income at placement | Not yet reported | Verified income is not a tape field; first reported in the quarterly update after this edition. |
| 6 | Departure rate | 8.8% per occupied record-year | Five departures over 678 occupied home-months (56.5 occupied record-years): three repossessions (5.3%), all re-placed; two voluntary moves (3.5%), one re-placed, one vacant since April 2026. Stated against occupied exposure rather than as “5 of 63 records over 36 months” (2.6%), because most homes have been on the tape for under 16 months. |
| 7 | Re-placement time | 3.2 / 4.8 / 5.9 months (mean 4.6) | The three repossessed homes. The re-placed voluntary departure took 5.0 months from re-listing; the vacant one had been listed 3.3 months at the cutoff. |
| 8 | Loss severity | Not yet reported | No realized loss is recorded on the tape: all three repossessed homes were re-placed and are current, and the realized-proceeds field is not yet populated for any exit. Computed per departure once re-placement contract values and exit proceeds are entered. |
| 9 | Resident equity accrued | Preliminary: median 6.6% of contract price | Share tracking on the tape records a resident equity position on 53 homes: median 6.6% of contract price (about $15,200 per household), $1.02 million in total. The tracking method is being verified by the manager before it is published as a metric. Down payments collected: $1,201,410. |
| 10 | Exit mix | No resolved resident contracts yet | 56 of 63 funded homes placed or sold. Resident buyouts and third-party refinances: none so far. Scheduled completions: none (the oldest contract is in year three). One home was sold for cash by the fund without a resident placement (January 2025; proceeds not yet entered on the tape). Departures: five (metric 6). |
| 11 | Cushion to basis | −2.2% (pool median) | Median across the 56 placed homes of (contract price − gross basis including the assumed lien) ÷ contract price; 23 homes above basis, 33 below. On the tape’s value field (contract price or an internal comparable, not an independent valuation) the pool is placed at basis. So the layer that absorbs a price decline is the resident’s down payment and accrued equity, not a mark-up. |
| 12 | In-place financing ratio | 87.6% at 4.0% | $14,322,162 of seller mortgages assumed on 61 of 63 homes against $16,352,720 of gross basis; balance-weighted note rate 4.0% (simple average of the rate field 3.89%); balances $14,030,193 at March 2026; range 2.38% to 6.63%. Maturities and amortization terms are not on the tape (Appendix A). |
Table 7: The reference dataset against the scorecard. Source: EasyDwell contract-level data tape v2.6 (as of 14 August 2026). Preliminary, unaudited asset-level operating data; not investor performance.
7.Risks, a Stress Test, and What Would Prove the Thesis Wrong
7.1 The Named Risks and What Limits Them
| Risk | What it is | What limits it |
|---|---|---|
| Occupant non-payment | The resident stops paying or abandons the agreement. | Written notice and fifteen days to cure (thirty for non-monetary defaults), with reinstatement available until a sale contract is signed. Arrears, escrow advances and enforcement costs are recovered before the ownership split. The resident’s equity is realized, not forfeited, so the down payment (median 7.8% of contract price) is money the resident has at stake, not a fee at risk. Possession is recovered as a non-tenant occupant under Chapters 66 and 82, not by foreclosure, and only after the equity is paid or tendered (Section 5.2). Performance history in Table 7. |
| Home price decline | Florida values fall, eroding the equity in the homes. | About 90% of returns are contractual, not tied to appreciation, and 30-year agreements remove any dependence on exit timing. Under the agreement a decline is shared by ownership percentage on any sale, so the resident’s equity is not a first-loss layer. The fund’s protection is that it does not have to sell: on a departure it can repurchase the resident’s units at the Starting-Value formula and re-place the home, carrying it at basis on the new resident’s payments (Section 5.2). On the current tape the pool is placed at the fund’s gross basis (median cushion −2.2%), so no mark-up cushion is relied on either. |
| Financing / in-place debt | Where homes carry in-place financing, the loans have due-on-sale clauses, original-borrower risk, insurance and escrow mechanics, and maturities that do not match 30-year agreements. | Fixed contract payments cover the underlying debt service, and no refinancing is needed to realize the return. This is the largest single sensitivity of any pool carrying in-place financing (metric 12); how the operator underwrites that debt is outside this paper. |
| Insurance and tax pass-through | Florida premiums and assessments rise; the increase reaches the resident’s escrow at the next review (annual, or sooner on a material change). | Pass-through protects the fund’s cash flow but passes an affordability shock to the resident. It is underwritten as a driver of default probability, not of yield. Investors should underwrite Florida insurance-cost and hurricane exposure explicitly: 59 of the 63 homes sit in FEMA Zone X and four in special flood hazard zones (A or AE). |
| Illiquidity | No secondary market; multi-year lockups. | Disclosed upfront; quarterly distributions provide some liquidity along the way; the fund’s plan for winding down 30-year contracts is stated in its offering documents. |
| Concentration | Single-state exposure: 62 of 63 homes are in Florida (the first purchase, in Washington State, is the exception), with the regulatory, insurance and climate exposure that implies. | The Florida homes are spread across 22 counties and 17 metropolitan or micropolitan areas. The five largest concentrations (Pensacola 16 homes, Jacksonville 13, Crestview–Fort Walton Beach–Destin 8, Ocala 4, Orlando 4) hold 45 of the 63. |
| Regulatory and litigation | Shared-equity occupancy agreements draw scrutiny (consumer-protection and foreclosure-equivalence arguments); disputes with residents or with sellers are a foreseeable feature of the model. | The structure has been reviewed by securities counsel. The agreement is drafted as an equity purchase with no note, no interest, no deficiency and a non-recourse surrender right; it records a memorandum of the resident’s interest, discloses the assumed mortgage from the lender’s statement, provides a review period, and advises the resident in writing to get HUD-approved counseling. Pending matters are disclosed in the offering documents. See Section 9. |
| Key person / execution | Returns depend on the manager’s sourcing and servicing discipline. Payment processing is done by an affiliate, not an independent licensed servicer; the agreement says so to the resident, who pays the servicer directly ($50 a month, with increases capped at 5% a year). | Documented SOPs, CRM-driven operations, third-party fund administration, escalation procedures; an advisory committee seat is available to qualified investors; the servicing roadmap states the trigger for moving to a licensed third-party subservicer. |
Table 8: Risk factors and what limits them. Source: EasyDwell Fund I offering documents (risk factors); author’s additions.
Two risks deserve emphasis beyond the table. First, model maturity. No operator in this segment has carried a large portfolio through a 2008-scale national housing downturn. The down-payment cushion and the contractual structure are well-reasoned defenses, but they have not been tested at scale. Second, headline risk. Structures that share economics with seller financing have drawn criticism when badly run elsewhere in the industry. Choosing a manager, and specifically looking at how the manager treats residents who fall behind, is therefore both an ethical screen and a risk screen. A model that only works when occupants fail is not durable. EasyDwell’s economics improve when residents stay, pay, and build equity.
7.2 Stress Test: What the Dataset Says Under Pressure
The sensitivities below are computed openly from figures stated in this paper, with the assumptions shown. They are illustrative and pool-level; contract-level stress output belongs in the data room.
| Shock | Assumption | Effect |
|---|---|---|
| Collection rate falls | From 97.2% to 90% / 80% of occupied home-months, with no re-placements | Contractual receipts fall 7.4% / 17.7% before any recovery, because receipts scale directly with collections. |
| Home prices fall | Values fall uniformly; departing residents are replaced at market | With the pool placed at gross basis (median cushion −2.2%), a home re-placed after a price decline is re-placed at a Starting Value below the fund’s basis by roughly the size of the decline. The fund’s return on that home is then carried by the new resident’s payments rather than by the asset’s value. The departing resident’s equity (median 6.6% of contract price recorded so far) is settled at the Starting-Value formula less arrears, so it absorbs the resident’s own arrears and costs, but not the fund’s share of the decline. |
| Due-on-sale acceleration | In-place loans are called and refinanced at the current conventional rate; contract payments unchanged | The largest single sensitivity of a pool carrying in-place financing: the gap between the in-place rate and the refinancing rate falls entirely on the pool, while the resident’s payment stays fixed. The tape does not yet show which loans could be called first, because it has no maturity or reset dates (metric 12). The exposure is quantified in the operator’s supplement. |
| Insurance shock | Premiums rise $1,500 a year per home | The fund’s cash flow is unaffected (pass-through), but the resident’s payment rises about $125 a month, roughly 5% of a $2,400 all-in payment. The effect arrives as a higher chance of default, which feeds the collection-rate row. |
| Departure and vacancy | Departures double from the observed 8.8% to about 18% per occupied record-year; re-placement takes the observed mean of 4.6 months | Each departure forgoes about 4.6 months of contract payment (roughly $8,500 at the pool median payment after escrow of $1,847), while the underlying debt service (median $1,148 a month) and the home’s taxes and insurance keep being paid by the fund: roughly $7,100 of negative carry per event (the agreement shifts carrying costs to the fund from the date of a repurchase notice), before a new down payment comes in. At the doubled rate that is about nine departures a year across the 52 homes occupied at the cutoff. |
| Timing | Placing inventory takes twice as long | The eleven homes without a paying resident at the cutoff carried $12,949 a month of underlying debt service with nothing coming in. The six unplaced homes held at the cutoff average $21,750 of out-of-pocket capital before a down payment; the pool-wide average is $36,138 per home. |
Table 9: Illustrative pool-level sensitivities computed from figures in this paper; not projections. A contract-level stress model (default rate × home-price index × insurance shock, with breakeven occupancy) is maintained by the manager and will be summarized in the next edition.
7.3 What Would Disprove This Thesis
8.Fitting It Into a Portfolio
Structured co-ownership does not fit neatly into a traditional allocation bucket, and that is much of its value. In practice, family offices evaluating the category have approached it through three lenses:
- As an income sleeve. Quarterly distributions sourced from contractual occupant payments position the strategy as a yield enhancer inside an alternative-income or private-credit allocation. $1M to $3M tickets are typical for a first commitment.
- As a diversifier. Because the cash flow comes from contracts, not from the market, the strategy is different in kind from listed REITs, core private real estate, and traditional fixed income. That fits the institutional shift toward low-correlation private strategies documented in Deloitte’s 2026 outlook.
- As documented impact. Each agreement creates a path to homeownership for a family excluded from conventional finance. Offices with impact mandates can report families served, resident equity accrued per household (scorecard metric 9), and housing-stability outcomes. That is measurable social return produced by the same contracts that produce the financial return, not by a side-pocket concession.
Diligence priorities for the category should include: the scorecard, reported on the definitions in Section 6; asset-level transparency (property-by-property schedules, payment status and valuations, rather than blind-pool NAVs); third-party administration and reconciled capital accounts; default and loss tapes; occupant underwriting criteria and servicing philosophy; how the manager treats residents who fall behind; the in-place financing schedule and the manager’s due-on-sale policy; and whether the GP’s economics reward long-term occupant success rather than churn.
9.Regulation and Law
Co-ownership structures sit where securities law, real property law and consumer-protection law meet.
At the fund level, a structured co-ownership vehicle is typically offered under Regulation D to accredited investors, with a limited partnership structure, a defined investment thesis, restricted-investment covenants and concentration limits in the partnership agreement, and quarterly reporting administered with third-party oversight.
At the asset level, the property-specific LLC is the load-bearing legal structure. Dividing a home’s economics into units gives the occupant a true ownership interest, while giving the fund payment priority and a remedies path that does not depend on mortgage foreclosure (Section 5.2).
At the consumer level, the central regulatory question for the category is whether shared-equity occupancy agreements will be treated, in substance, like mortgage credit, with the disclosure, servicing and foreclosure-protection rules that come with it. The map has three branches. First, characterization. Florida law has long treated instruments meant to secure the payment of money, including agreements for deed, as mortgages (Fla. Stat. § 697.01), so an agreement that looks like seller financing in substance risks being enforceable only through judicial foreclosure. The co-ownership agreement is drafted as an equity purchase-in, with no principal advanced to the resident and no debt claim against them, precisely to sit outside that pattern: no note and no interest; equity payments that buy units at a fixed book-value price with no premium; an occupancy charge set as a fair-value use charge from documented comparables (drafted to qualify as a shared equity financing agreement under I.R.C. § 280A(d)(3)); a surrender right without deficiency; equity realized rather than forfeited on every default path; and possession recovered by ejectment or unlawful detainer rather than foreclosure (Agreement §§4, 8.4). The agreement itself says that the characterization remains subject to applicable law. Second, the financing chain. Federal law (Garn-St Germain, 12 U.S.C. § 1701j-3) generally lets lenders enforce due-on-sale clauses on a transfer, which is the legal source of due-on-sale acceleration exposure for any pool carrying in-place financing. Third, consumer credit. If the agreement were found to be credit in substance, disclosure, licensing and servicing regimes would apply. Prudent operators get ahead of all three by building mortgage-grade fairness into the agreements voluntarily: clear disclosures (Section 5.2 lists EasyDwell’s), equity protection for residents who leave, and documented loss-mitigation practices. The quality of that documentation is core diligence.
10.Outlook: From Niche Structure to Recognized Asset Class
Over the next decade, residential co-ownership will likely follow the path single-family rental took after 2012: a fragmented, operator-driven niche consolidating into a recognized allocation as track records lengthen, reporting standardizes, and securitization channels open. HEI portfolios already attract institutional securitization. The amortizing, contractual cash flows of structured co-ownership are arguably a better fit for it than appreciation-only contracts.
The financing chain the HEI market has already walked defines the road map. It moved from operator balance sheets, to bilateral asset purchases, to rated securitization with repeat issuance. For structured co-ownership the same three stages are visible: forward-flow purchases of newly originated contracts against a published buy box; dedicated separately managed cohorts with static-pool quarterly reporting; and, once a pool reaches scale, a rated securitization of seasoned co-ownership contracts. Early participants shape the rateable pool. The buy box, the tape fields and the servicing standard are being built to securitization discipline now, and the scorecard in Section 6 is the reporting layer that chain requires.
The category is heading toward scaled, transparent, mission-aligned platforms that turn America’s housing-access gap into durable investor income. Whether it gets there depends on whether operators publish comparable data, and on whether the first national downturn confirms or disproves the correlation argument. This paper will report on both, every year.
Conclusion
Co-ownership in residential real estate is less a new way to bet on home prices than a new way to be paid for solving a financing problem the conventional system has stopped solving. The conditions are durable: a 6.0x price-to-income market, a first-time-buyer cohort cut in half, a shortage of roughly 1.2 million homes, and a large cash-rich, credit-poor population. The structures that monetize them range from appreciation-linked (HEIs, fractional vacation ownership) to income-generating (structured co-ownership). The Five Tests in Section 2 are offered so that the distinction can be made the same way every time.
For allocators who want contractual, low-correlation income with asset-level transparency and documentable social impact, structured co-ownership occupies a place on the risk-return spectrum that few existing allocations reach. The reference dataset, 36 months of contract-level payment history reported against a published scorecard with its missed payments, departures and vacancies stated, is early but real evidence that the model performs as designed. It will be extended every year.
About the Author · How to Cite
Raphael Locsin is the founder of EasyDwell and the architect of the structured co-ownership model described in this paper: the buy box, the underwriting standard, and the contract framework every fund property runs on. As Portfolio Manager he owns portfolio construction and maintains the contract-level data tape that goes to investors in diligence, and he has built and run the strategy through 36 months of contract servicing in Florida workforce markets. EasyDwell Research publishes this paper and its annual editions. Research inquiries, data requests and disagreements with the definitions are welcome.
Contact: Raphael Locsin, Founder & Portfolio Manager · raphael@easydwell.com · 562-760-8462 · www.easydwell.com/research
How to cite this paper
Locsin, R. (2026). Structured Co-Ownership in Residential Real Estate: Definition, Taxonomy and Performance Standard. EasyDwell Research, Inaugural Edition, Version 2026.08. www.easydwell.com/research.
Versioning: annual editions carry the year and month (v2026.08); quarterly scorecard updates carry the quarter (2026 Q4). Figures should be cited with the version.
License: free to share and cite with attribution; the definitions and scorecard may be reproduced and adopted by any operator. A DOI is assigned on publication.
Appendix A: Method, Definitions and Reconciliation
Reporting window. The servicing record (Section 6.3) covers 36 months of contract-level payment history, August 2023 to July 2026, across the 63 funded homes in data tape v2.6 (cutoff 14 August 2026; underlying loan balances as of the March 2026 statements). It spans Fund I-era and earlier SPV entities; which entity holds which home is still being verified, and two homes were added on 14 August 2026 pending confirmation. The investor distribution record and the capital bridge are reported in the operator’s private supplement and are not part of this paper.
Scorecard computation. Metrics 1, 2, 6 and 7 are computed from the payment matrix (one cell per home-month: paid, occupied but unpaid, vacant or pre-placement, with collections received while vacant flagged for review). Metrics 3, 4, 11 and 12 are computed from the acquisition and placement fields (gross basis, assumed lien and rate, contract price, down payment). Metric 9 comes from the tape’s share-tracking field and is preliminary until the manager verifies the method; its definition matches the agreement’s “Equity Balance” (initial contribution plus equity purchases made, Operating Agreement Article XI). Metric 10 comes from the tape’s exit, buyout and departure fields. Metrics 5 and 8 need fields (verified income; re-placement contract values and realized exit proceeds) that are being added to the tape and will be reported from the next quarterly update.
Data-tape reconciliation notes (v2.6). (1) The tape’s headline servicing figures (678 occupied home-months, 659 paid, 19 missed, 97.2%) differ by one month from the sum of its per-home columns (677 / 659 / 18); the headline is used here. (2) The in-place financing rate quoted in earlier materials, 3.89%, is the simple average of the tape’s rate field across 62 entries, including two recorded at 0.00%; the balance-weighted rate on the 61 assumed liens is 4.0%. (3) Three early contracts (the first three homes placed, in 2023 and early 2024) have no equity component in the tape’s share model; the existing placements were made under earlier forms of the agreement than the August 2026 form described in Section 5.2, and the count of contracts by form and structure remains a reporting item. (4) The tape’s value field is the resident contract price or an internal five-comparable estimate; on 24 homes the two are identical. Independent valuations are on the tape’s gap register. (5) The $1,201,410 of down payments includes $112,000 on five homes not counted as placed at the cutoff. (6) The tape records no maturity, amortization type, reset date or lender type for any assumed loan (each transaction file’s Appendix A does), and no realized proceeds for its one cash exit; both are on its gap register.
Escrow. The resident’s property tax, insurance and association-dues pass-through, reviewed by the servicer at least once a year and reset on at least thirty days’ notice when a bill changes materially (Agreement Appendix C). It is never treated as fixed, never counted as income, and left out of every payment and yield figure in this paper.
Audit status. Financial statements are prepared and reconciled under third-party fund administration (NAV Fund Administration); they are not audited. Servicing data is preliminary and unaudited. No audit or agreed-upon-procedures engagement has been decided for FY2026; the decision will be stated in the next edition.
Data sources. The contract-level data tape (one row per home: origination date, acquisition basis, in-place financing, contract price, ownership percentage, down payment, payment split, full payment history, delinquency and cure events, departures, buyouts and refinancings, realized proceeds on exits; refreshed quarterly as static-pool reporting); the EasyDwell Co-Ownership & Equity Purchase Agreement, August 2026 form (buyer’s annotated copy with operating agreement, servicing agreement, appendices and exhibits), for the contract terms in Sections 5.1–5.3 and 9; third-party market data as cited.
Appendix B: Sources and Further Reading
- EasyDwell contract-level data tape v2.6 (payment history August 2023 to July 2026; cutoff 14 August 2026).
- NAHB, “2026 Housing Outlook: Ongoing Challenges, Cautious Optimism and Incremental Gains” (Feb. 2026): housing shortage, lock-in effect, rate expectations.
- Fortune / AEI Housing Center (Apr. 2026): price-to-income divergence; homeownership-rate declines by cohort; supply diagnosis. Capital Economics via Fortune Intelligence: first-time buyer volumes (~1.1M in 2025) and recovery outlook.
- Heartland Institute (May 2026): first-time buyer age (40), rent inflation, foregone-equity estimates. Axios / Realtor.com / Redfin (Jan. 2026): 2026 mortgage-rate forecasts; co-buying and household-formation trends.
- myFICO.com via The Mortgage Reports (May 2026): conventional mortgage rates by FICO tier; PMI illustrative at 97% LTV. Freddie Mac PMMS: 30-year fixed mortgage rate history, 2023–2026.
- Deloitte, “2026 Commercial Real Estate Outlook”: institutional demand for low-correlation private strategies and specialist operating partnerships.
- Money.com, “Best Home Equity Sharing Companies of June 2026”: HEI provider landscape (Point, Hometap, Unison, Unlock, Splitero); Pacaso and Amerisave industry guides (2026): fractional co-ownership mechanics; cooperative housing statistics.
- Momentum Realty (Move With Momentum Housing Research), “Florida Housing Market Tracker,” release of 24 August 2026, an analysis of Zillow Research home-value, inventory and price-cut series through July 2026. FHFA House Price Index (Florida vs. national, Q3 2025) and S&P CoreLogic Case-Shiller (Tampa, November 2025). Insurify, “2026 Insuring the American Homeowner Report” (Florida average premium, 2025). Freddie Mac PMMS, 30-year fixed rate, 2023–2026.
- Auken, I., “Welcome to 2030: I own nothing, have no privacy, and life has never been better,” World Economic Forum Agenda and Forbes, 10–11 November 2016 (later retitled “Here’s how life could change in my city by the year 2030”); World Economic Forum, “8 Predictions for the World in 2030,” 16 November 2016.
- Fla. Stat. § 697.01 (instruments deemed mortgages); Garn-St Germain Depository Institutions Act, 12 U.S.C. § 1701j-3 (due-on-sale clauses).
Appendix C: Disclosures
This paper is a research publication provided for informational and educational purposes; it is not an offer to sell or a solicitation of an offer to buy any security, and not investment, legal or tax advice. The author is the founder and portfolio manager of EasyDwell, whose affiliate manages a private fund that invests in the strategy described here; the author and EasyDwell therefore have a financial interest in the adoption of structured co-ownership as an asset class. Any offering of fund interests is made only to qualified investors through the fund’s definitive offering documents, which are not part of this paper.
Past performance is not a guarantee of future results. Figures attributed to EasyDwell reflect a limited operating period and a small asset base, are unaudited, and may not be indicative of future performance at larger scale; items marked as pending certification are presented as reported by the manager. Third-party data is drawn from sources believed reliable but is not independently verified. Investments in the category are illiquid and involve a high degree of risk; readers should consult their own legal, tax and financial advisors. The definitions and standards proposed here are the author’s and are offered for public comment and adoption.
Download the full paper
33 pages, with all tables, figures and appendices. Free to share and cite with attribution.
EasyDwell Research · EasyDwell Ventures, LLC · 25 SE 2nd Ave., Suite 550, Miami, FL 33131 · www.easydwell.com/research — A public research paper. Free to share and cite with attribution. Not an offer to sell securities.